Hyperspectral Rrs Examples
The following file contains seven examples of hyperspectral remote sensing reflectance (Rrs) spectra. These spectra were subjectively selected and compiled with the goal of providing examples of a variety of spectral shapes from different waters. Please read below for more information on the file contents.
This data file is available for research uses only. It was compiled by the NASA Ocean Biology Processing Group at Goddard Space Flight Center, Maryland, USA, using generous data contributions from the ocean color research community. Source bio-optical data are available online via a suite of SeaBASS Search Engines. Access and use are governed by the SeaBASS Data Access Policy. Please direct comments, questions, and identified issues to the SeaBASS Administrator.
Table of Contents
Download
| Download (Right click and select "save as") | Map | Last Updated |
|---|---|---|
| hyperspectral_examples_v1.0.csv | Map v1.0 | 2012-12-14 |
The data set download is provided as comma-delimited ASCII text with meta-data headers and comments similar to the standard format of SeaBASS files.
Description
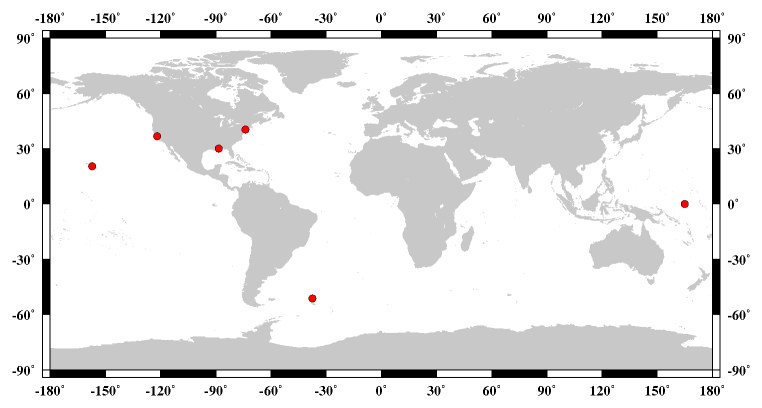
The data are presented in a comma delimited matrix found below the following header information. The first "column" of data contains wavelengths and the other 7 columns (i.e. columns 2-8) are example spectra.
| Column # | Brief Description |
|---|---|
| 1 | wavelength |
| 2 | South of Dauphin Island, AL, USA |
| 3 | Monterey Bay, CA, USA |
| 4 | Hudson Plume, NY Bight, USA |
| 5 | Southern Atlantic Ocean |
| 6 | Equatorial Pacific Ocean |
| 7 | West of Lanai, Hawaii, USA (data from MOBY) |
| 8 | West of Lanai, Hawaii, USA (data from MOBY) |

General notes about the file contents (these comments can also be found in the header):
- Time is in GMT
- Remote Sensing reflectances (i.e. Rrs (1/sr)) were calculated from the ratio of water-leaving radiance to downwelling irradiance just above the surface.
- Above water hand-held radiometers (SPECTRIX) were used to measure Rrs for columns 2, 3, 4 and 5. Except for 1 nm interpolation, no additional calculations were performed on those Rrs values in the making of this example file. Column 6's Rrs values were calculated from subsurface products from SPMR/SMSR and a Satlantic Hyper-TSRB. Columns 7 and 8 were from MOBY with subsurface measurements paired with surface Es measurements. Rrs values in columns 6, 7 and 8 were calculated by propagating subsurface Lu to Lw and then dividing by Es.
- All data were interpolated to 1 nm integer resolution using MATLAB's cubic spline function. Some files were originally at ~1 nm resolution (i.e. columns: 2, 7, 8; 6 was already interpolated to 1 nm by the submitter), and others (i.e. columns: 3-5) were submitted to SeaBASS at 5 nm resolution.
- To reduce noise in MOBY data (columns 7 and 8), a moving average (7 point average) was applied to Rrs data where wavelength <= 400.
Acknowledgements
Many thanks to NASA and SeaBASS for providing data. P. J. Werdell, S. W. Bailey, G. Fargion, C. Pietras, K. Knobelspiesse, G. Feldman, and C. McClain, "Unique data re-pository facilitates ocean color satellite validation," EOS Trans. Am. Geophys. Union 84, (2003).
Special thanks to the multiple investigators who submitted data to the SeaBASS archive that was used in creating this file, including Bob Arnone, ZhongPing Lee, Marlon Lewis and the MOBY Operations Team.
Special thanks to the multiple investigators who submitted data to the SeaBASS archive that was used in creating this file, including Bob Arnone, ZhongPing Lee, Marlon Lewis and the MOBY Operations Team.
A cruise name accompanies each data record. Cruise details, including contributors' names, are available online using the General Search and Cruise List utilities to facilitate communication, collaboration, and acknowledgement.
Last edited by Chris Proctor on Apr 19 2017 12:00AM
Created by Chris Proctor on Dec 11 2012 12:00AM